
Stefan Sagmeister’s new shoe designs are actually walking infographics
Data visualization turns charts, data, and statistics into something easier to comprehend. Turning that data viz into shoes makes the data into a functional conversation starter. That’s what the Austrian graphic designer Stefan Sagmeister did with two shoes he designed for Ekn, a German foo
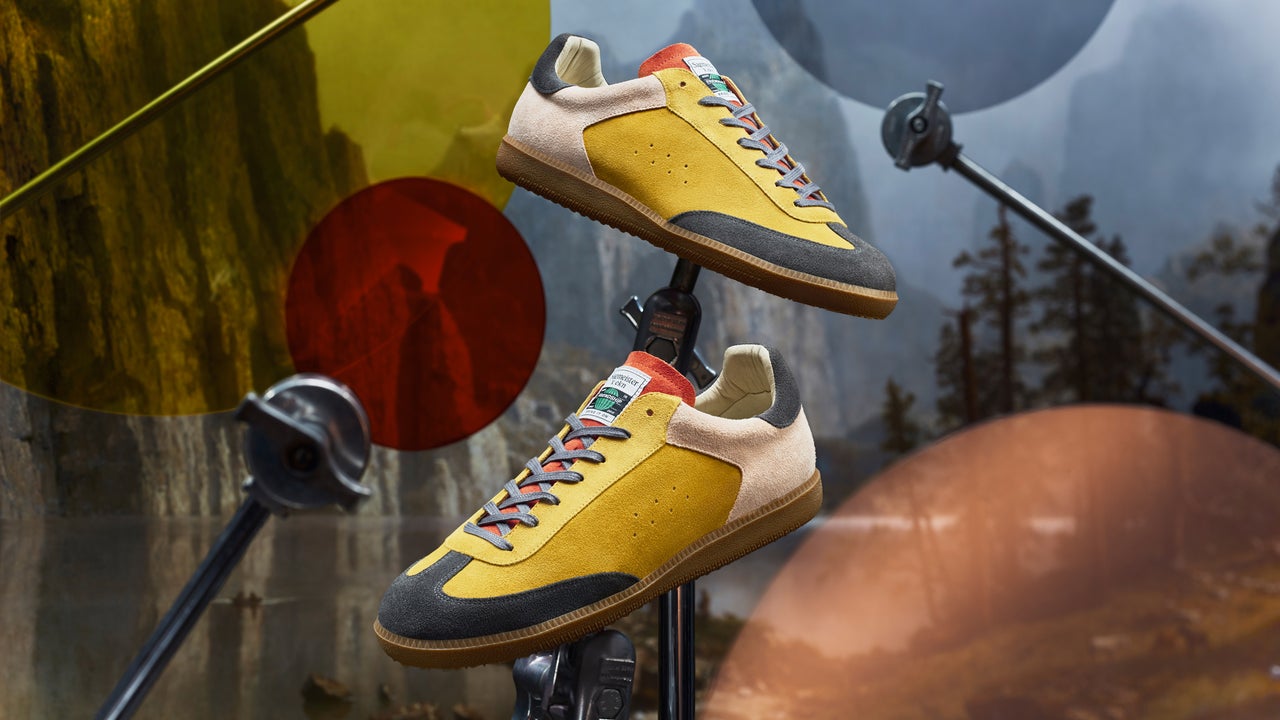
<p>Data visualization turns charts, data, and statistics into something easier to comprehend. Turning that data viz into shoes makes the data into a functional conversation starter.
That’s what the Austrian graphic designer Stefan Sagmeister did with two shoes he designed for Ekn, a German foo</p>